https://www.youtube.com/watch?v=IUZEtVbJT5c
As I am writing this, it has been nearly a day and a half of doing nothing on the project. I just got through the brunt of the training to lead NSO next week, and wanted to update the blog on the progress I made before training but didn’t have time to share here. When I last updated the blog, I vaguely explained that my evening had been crazy. After meeting with Steve about the posters, I spent the evening beginning a code to find the 814 sources, average magnitudes between them and match them to their corresponding stars in 606. As was the case with the first few catmat codes, I felt that I was pushing the boundary of my coding comfort. With the 814 code, I felt this even more, and I came up with very inefficient ways to do the things I needed to do.
catmat814.py functions similarly to all of my other catmat codes, but it matches between all 9 814 catalogs and the one 606 master catalog. I also needed to check for duplicate matches, so most of the length of my code is running 36 for loops on the products of 36 intersection statements. I did come up with a few pieces of code I am proud of though, like my function avgvals which finds the average of the non-zero values of an array. Basically the end result of this code is a new array which has both 606 and 814 values adjacent to one another on the same array. I was so happy when this code finally worked after a lot of frustration and hopelessness, which is why my post is titled the way it is…
It was happily easy to take this hard-fought output and turn it into a color-magnitude digram.
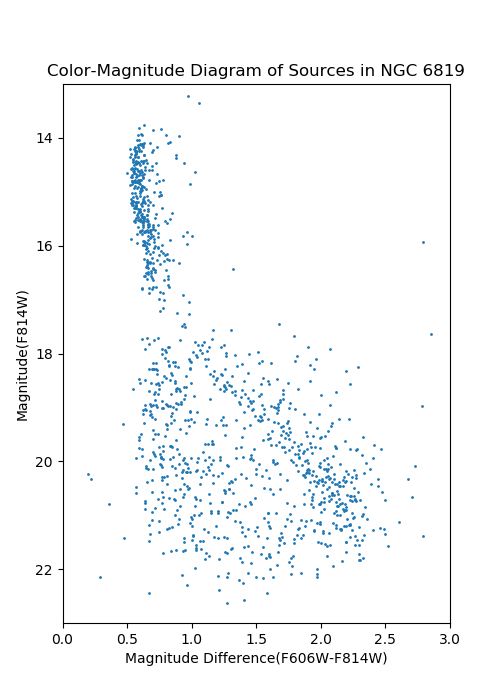
It was a huge sigh of relief as well to see that the color-magnitude diagram reasonably captures the main sequence of the cluster. There is a clear concentrated vein of sources running vertically down the left side of the diagram then more diagonally to the lower right corner of the diagram. It is evident that the photometry process involved discarding a lot of sources with insufficient photometric data or quality. I would love a more full CM diagram, but think that even though the data used to construct mine is less complete than the data used to construct a diagram like that made by Kalirai et al. (2001):

This one is also created with B and V filters (445 nm and 551 nm respectively) so it is not even showing the same thing, but even though it has some differences from our CMD, it displays largely the same pattern of a fairly uniform group of bright, bluer stars and the main sequence getting dimmer and redder while many non-main sequence red and blue stars are present below the main sequence.
Overall, I am so happy to have this diagram. I was worried I may reach a point where I had to choose continuing on the CMD or beginning my poster, so I am happy to have the CMD done and be able to focus on the poster over the next four days.