More Sourcery! And new Data
Playing with source detection parameters
I figured out some new things with my source detection code and want to show here what kind of results I get with different parameters. So here are some examples of what different parameters affect.
Firstly here is the figure produced with DAOStarfinder set to full width half maximum=8, Threshold=200*std, and the redpoint of the contrast at 10 counts/sec.
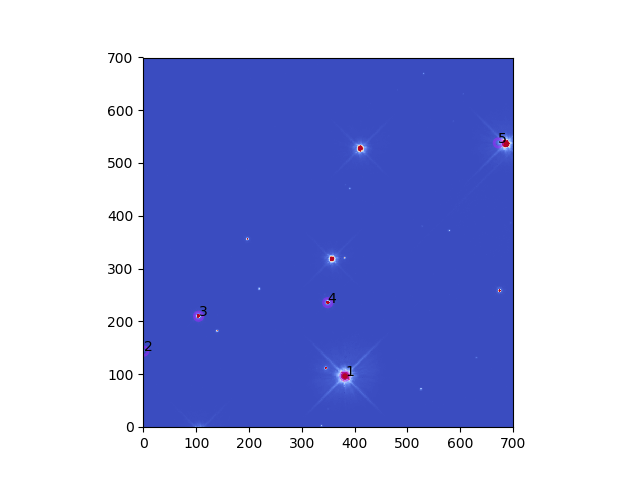
The numbered purple circles show where DAOStarfinder found sources in the image. The source detection is fairly incorrect here. It misses most sources in the image.
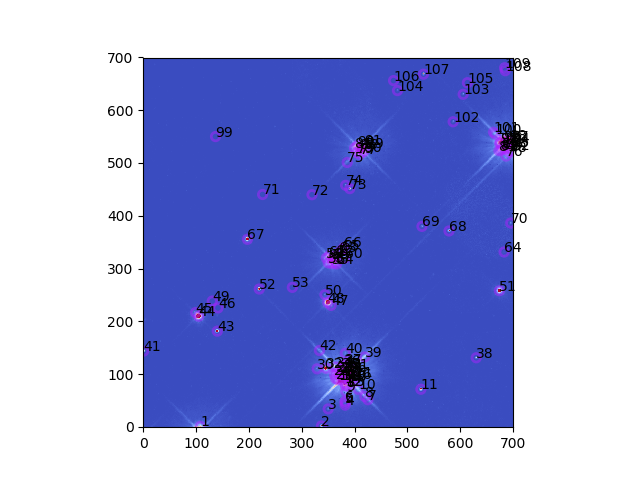
Trying again with fwhm=4 and other parameters the same the program produces this:
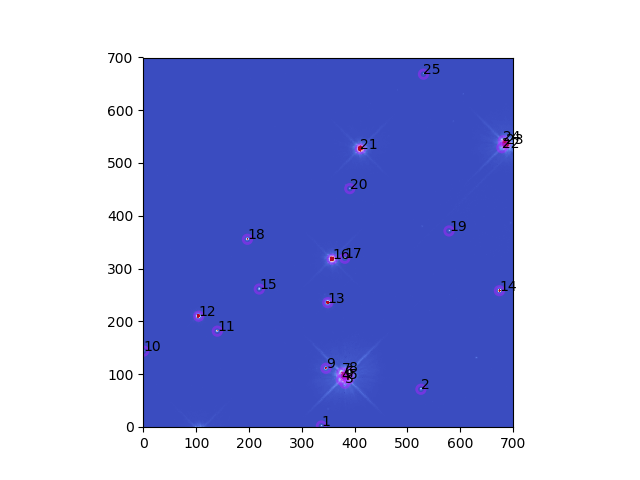
This method captures almost all of the sources that we can see here. It also captures some extraneous sources in the diffraction spikes of the other sources, but with zoom, we can distinguish which aperture is actually centered on the source and which isn’t. Another thing to consider is our contrast. The redpoint in this image is 10 counts/second. What will the image look like if we turn down the redpoint?
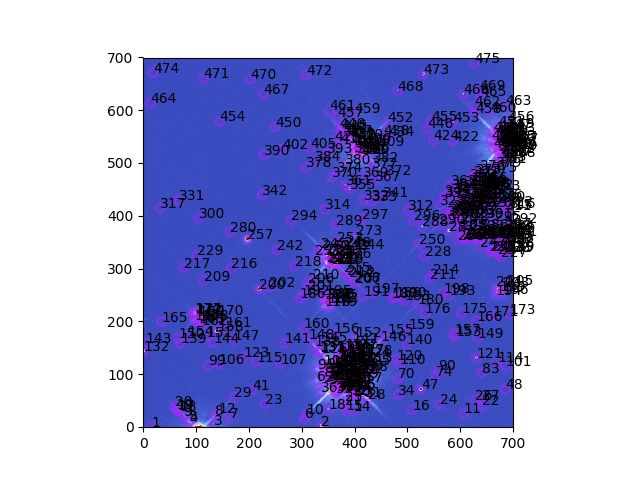
Here is an image of the same DAOStarfinder parameters but with a redpoint of 2 counts/second.
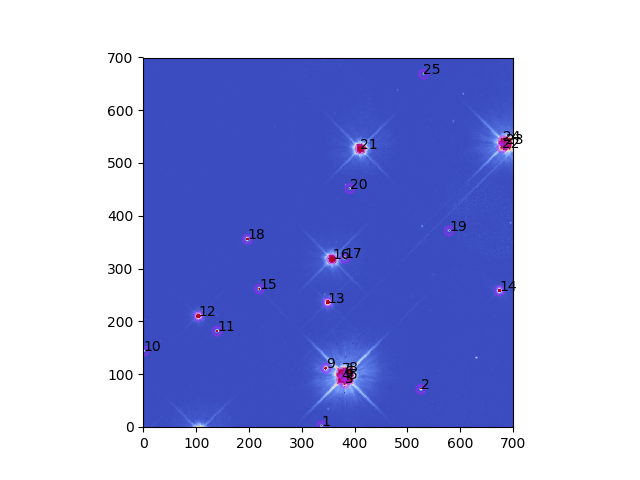
Now we see that there are some dim sources that we missed with these DAOStarfinder parameters. There is a triangle of sources in the upper right-hand corner and some other miscellaneous sources throughout the image.
If we lower the threshold down to 20*std this is what happens
Now we have way too many sources, although it doesn’t look like we missed any sources (at least no sources we can see with this contrast)
Ok now mostly for fun, let’s lower the fwhm to 2, the threshold to 5*std and the redpoint to 1 count/sec
This is absurd, there are practically hundreds of detected sources around each bright source. However, I am fairly certain that this method caught every real source visible in this image (and a lot of extras).
So it seems like we have to either capture extra sources or miss some sources. Our source detection cannot be perfect. It will be better for our project to detect more sources than there actually are and avoid missing sources. We can always not use aperture photometry data from non-sources, but we can’t fabricate aperture photometry data for sources we did not initially detect.
A helpful tool for this source detection algorithm would be a way to measure the FWHM of the sources on the image since it is hard to tell by simple inspection. I am still poking around looking for a way to calculate this for future source detection.
Trying to get FLC/FLT data
I’m now working on trying to download new Hubble image files. DRZ files are good for astrometry, but not as good for photometry. We want FLC or FLT files which contain more unfettered data about the number of counts on each pixel.
On the MAST archive, getting this FLC/FLT data is easy, after adding the desired files to the download basket you just need to uncheck the box on top of the download basket that says minimum recommended products, go down to the bottom of that list and select either FLT or FLC. FLC files are corrected for charge transfer efficiency (CTE) so they are a higher quality data product, so I will opt for those.
The only issue with MAST is that there are only FLC/FLT files available for the HST data. The HLA data (which was taken on the same dates as the HST data, but is already mosaiced?) does not have flc or flt files available. For now, I’ll grab the HST FLC data.
I need to download in two batches because the .sh files are a pain and there is only a little more than the limit in the basket that I need.
I left these images on the mac desktop that I have been using and I will put them on one of my drives as well.